Journal
Total tracked time in the schedule timeline
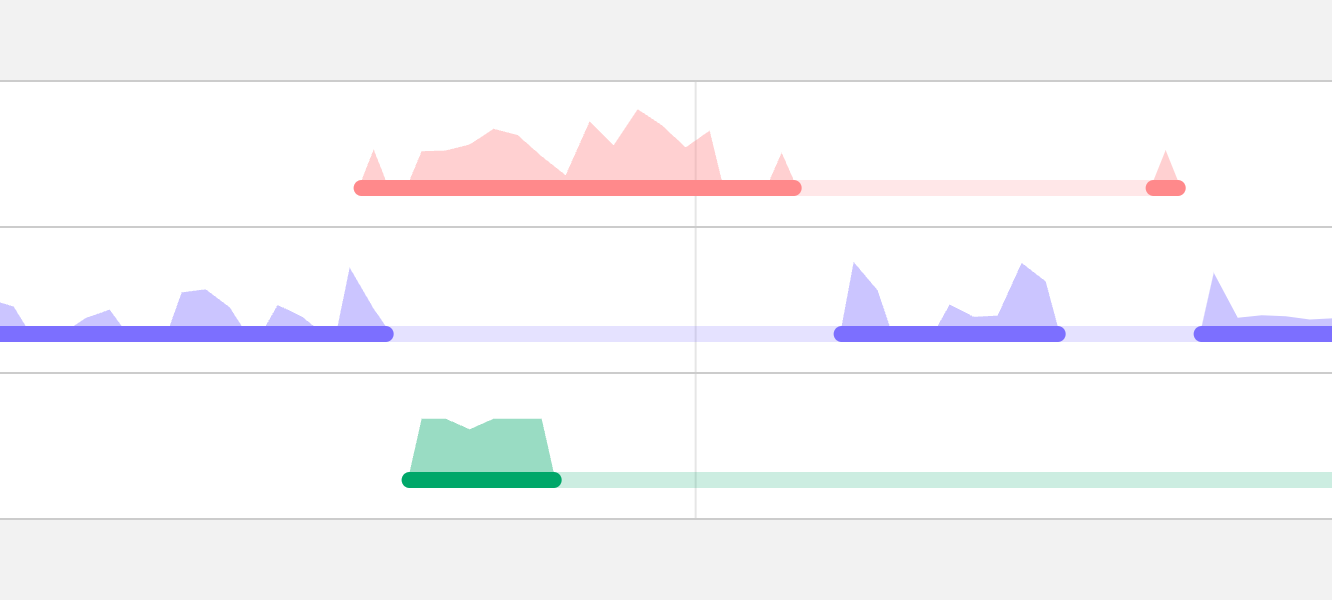
The most recent step in Cushion’s roadmap was visualizing tracked time, which is nice-to-see, but not entirely useful on its own, but that was the point. This actually laid the groundwork for a much more useful feature—total tracked time. I honestly still don’t have a great name for this, but “total tracked time” is the closest I’ve come up with. Essentially, Cushion takes all of your tracked time and combines it at the top. While before you could see how much effort you put into individual projects, now you can see how much effort you put into your day-to-day, regardless of project. This is much more valuable to see because Cushion can now highlight when you’ve overworked yourself, so you can learn to avoid it next time.
Total tracked time grouped by week
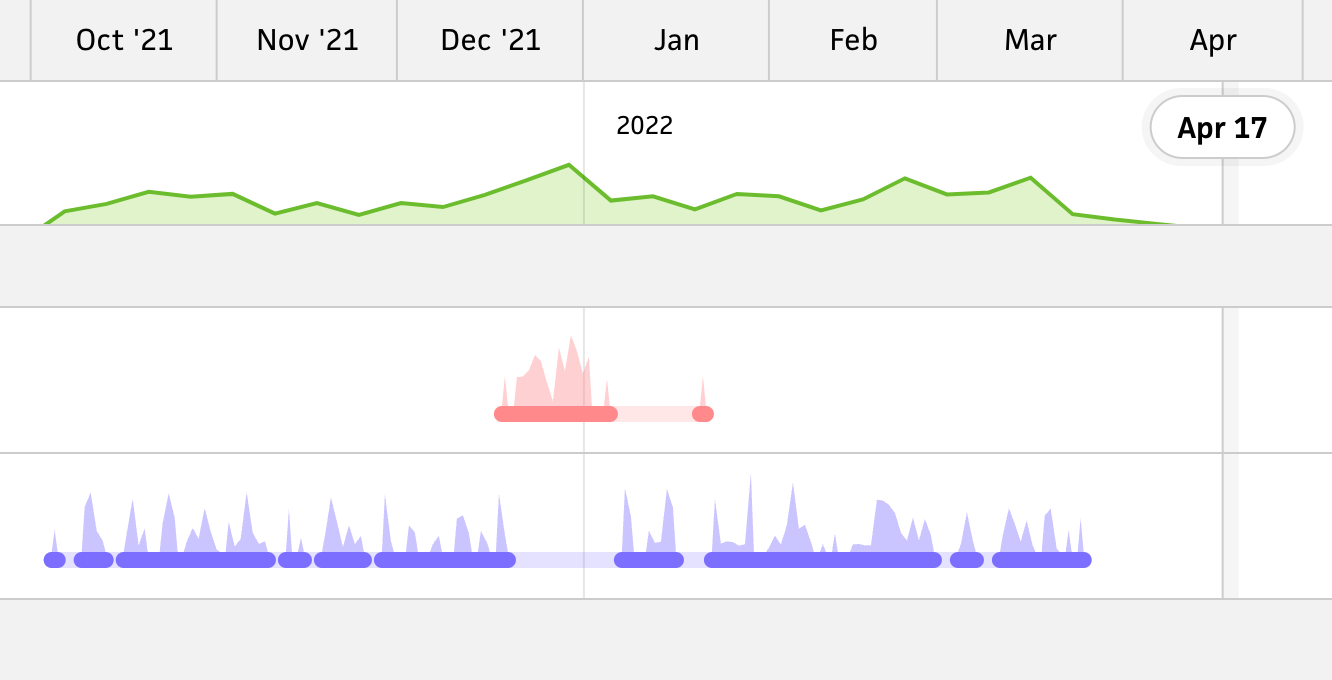
Since I already wrote the code to visualize tracked time into an SVG path, I had a great starting point for hoisting that into a combined view. Instead of passing only the entries for a given project, I passed all the entries. I immediately realized, however, that seeing every day’s entries isn’t that valuable compared to a summarized look. For instance, when you zoom out to the year view, where you’re looking at a span of a dozen months, it’s much more useful to see entries grouped by week. As a freelancer, I can see how much I actually worked in a given week and get a sense for my “sweet spot” for work/life balance.
When I added the grouped-by-week view, I immediately saw an opportunity for a slick transition between zoom levels. (If you haven’t noticed, slick transitions are a very high priority when building Cushion.) The obvious transition is transforming the path itself, but this requires having the same number of points and transitioning those points. It’s definitely doable, but since I was breaking my spans of entries into multiple paths, the transformation would’ve required a lot more extra work—and there’s no guarantee it would look good. Instead, I thought of a more relevant transition.
Since we’re zooming out to the grouped-by-week view, I could play with a “faux” depth effect and make it look like we’re zooming on the z-axis as well by animating scale. As we zoom out, the day-to-day path for tracked time scales down while the grouped-by-week path scales in. This provides a map-like effect for obscuring detail in the zoomed-out view, then zooming in reveals that detail again. I don’t know about you, but I’m absolutely over-the-moon about how this turned out!
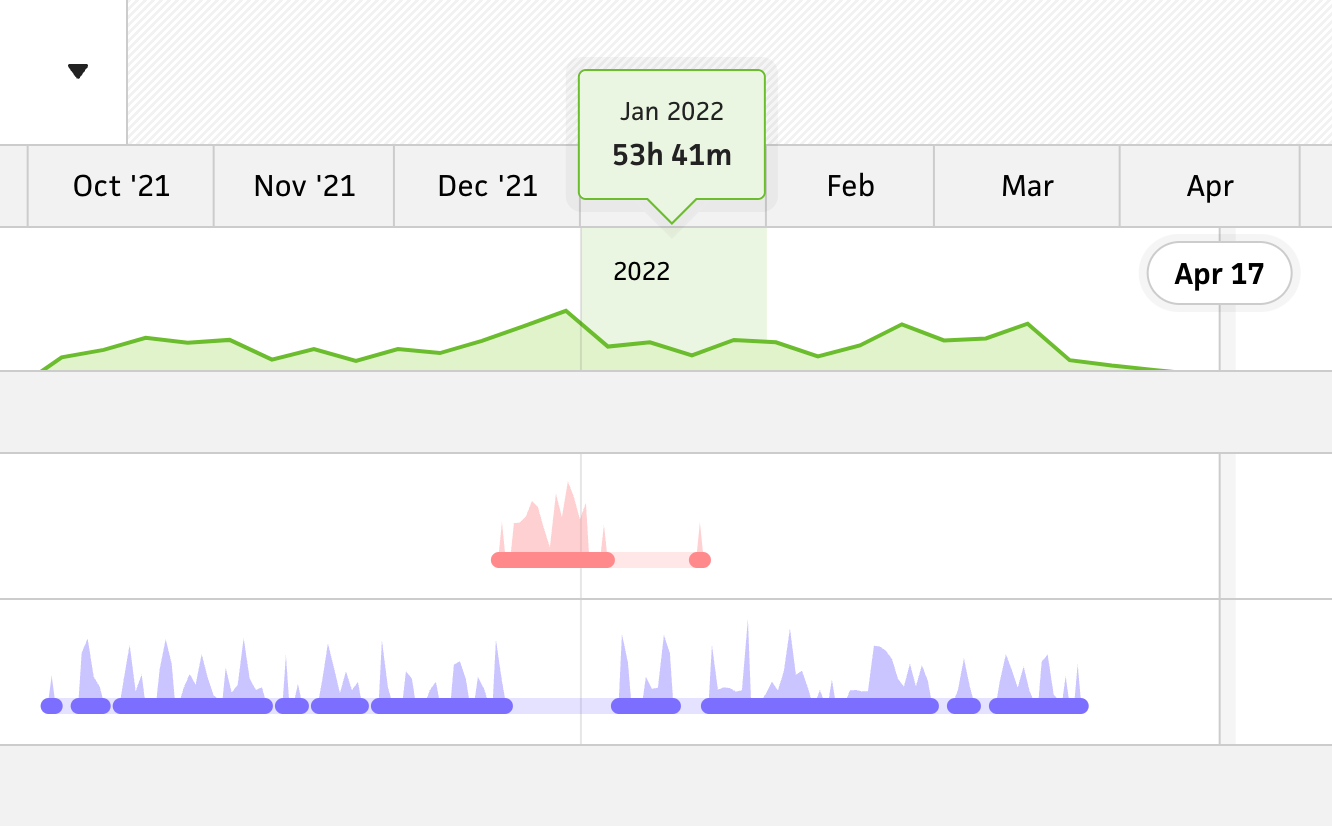
After wrapping up the grouped-by-week path, I assumed I’d need to make a grouped-by-month path for when you zoom out to the year view, but I was actually surprised to see that it didn’t add much value. Unless you’re taking a few weeks off or overworking yourself for an entire month, the path is relatively the same month-to-month. Instead of going forward as planned, I decided that it’d be more valuable to keep the grouped-by-week path for the year view as well. Since it is valuable to know the number of hours you tracked for a given month, I could highlight the tally on hover using a tooltip.
Highlights when you overwork yourself
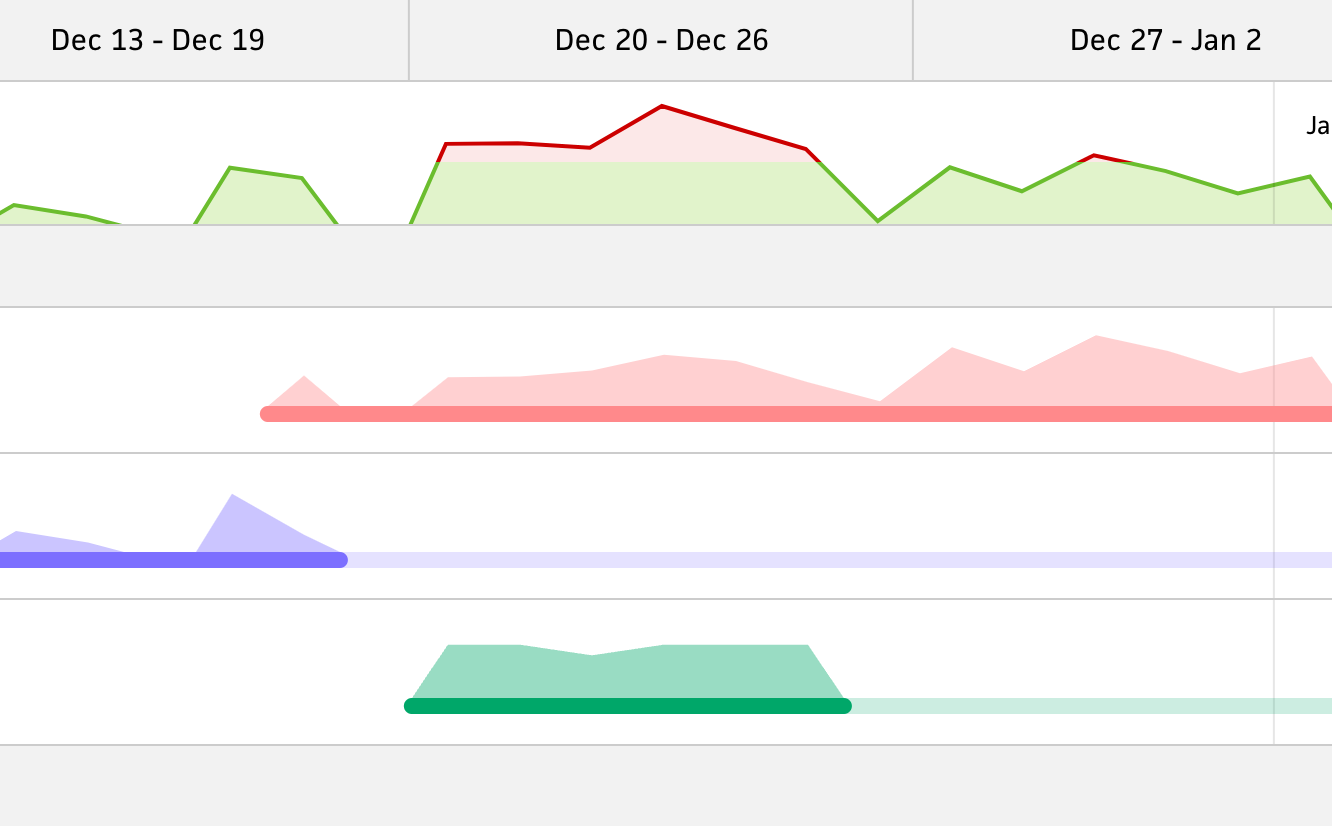
Now that I had the two path groupings (weekly and daily), I needed to add the most important feature—highlighting when you overworked yourself. Since Cushion already has scheduling features based on workload, there’s actually a “workday” setting to let folks specify how many hours they consider a full workday. Using this variable, Cushion can easily highlight when you overworked yourself because it’s just a matter comparing tracked time to that number. If my workday is 7 hours and I work 8 hours, then 1/8th of the path will be red for that day.
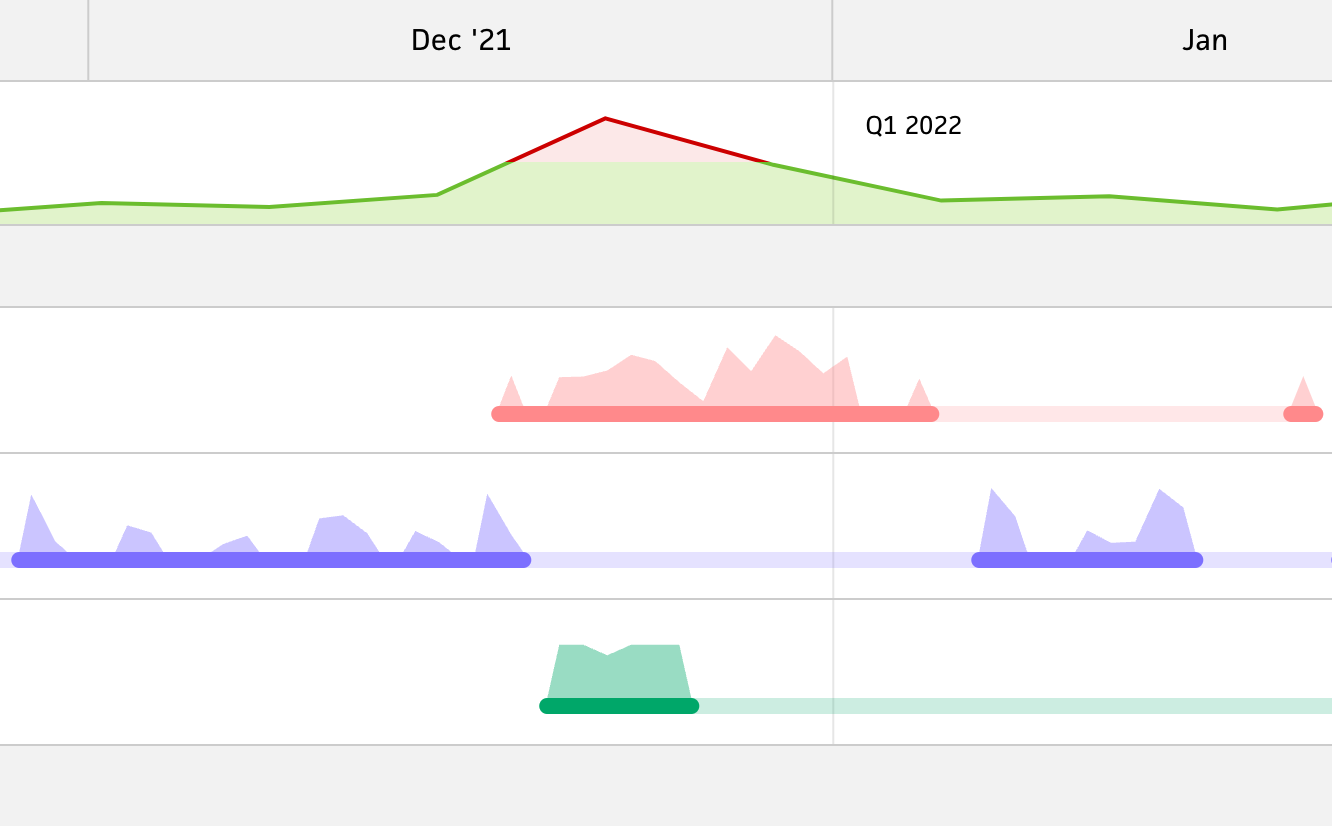
Highlighting when you overworked yourself on a given day is straightforward, but it becomes slightly more difficult when dealing with weeks because now we need to factor which days you work. Luckily, Cushion also has a setting for this variable, letting folks toggle their workdays throughout the week. This setting is especially useful for those who freelance part-time and only work a few days a week. By multiplying your workdays with the hours in your workday, Cushion’s able to calculate your entire workweek and measure your tracked time against it.
This is a good stopping point for now, but I’m still only scratching the surface of what I have planned for the timeline. While all of these time-tracking features focus on the past, the next set of features focus on the future. Instead of time spent, Cushion will visualize estimated time, and instead of highlighting when you overworked yourself, Cushion will highlight when you overbooked yourself. This feature already exists in the legacy schedule timeline, but it’ll be significantly upgraded in the new timeline. I can’t wait to build it!