Journal
Estimated workloads in the schedule timeline
In the previous sprint, I focused on visualizing tracked time in Cushion, which is a representation of the past—you do the work, track the time for it, and you have a down-to-the-second recording of your effort. Once I got that under my belt, the obvious next step (to me) was visualizing estimated workloads, or the future. Whereas tracked time is factual, workloads are an estimate—you may or may not actually work the number of hours you plan to work, if at all (if the project is canceled, etc.). Because of this, workloads should look clearly different from tracked time, in a way that indicates that they’re more “fuzzy” than a recording of time.
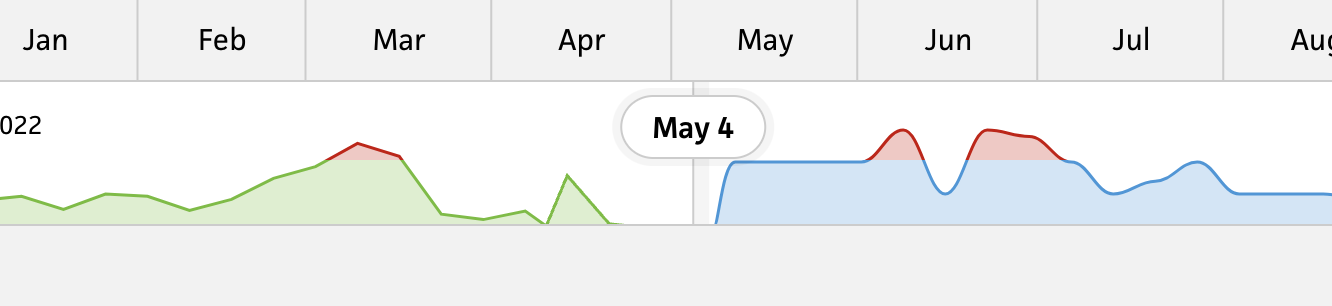
Total tracked time versus total estimated time
Piggybacking off my prior idea to draw tracked time as a rigid path, I decided to use a curved path for estimated workloads. The distinction might be enough to separate the two between the past and the future, but also when comparing them once workloads end up in the past—answering questions like, “Did you end up working the 20 hours you estimated for that project this week?” On the technical side, curving the past was simply a matter of using a cubic bezier curve for the path command instead of a line. I had already done most of the heavy lifting with visualizing tracked time that now I only had to calculate time-based duration of workloads for each day.
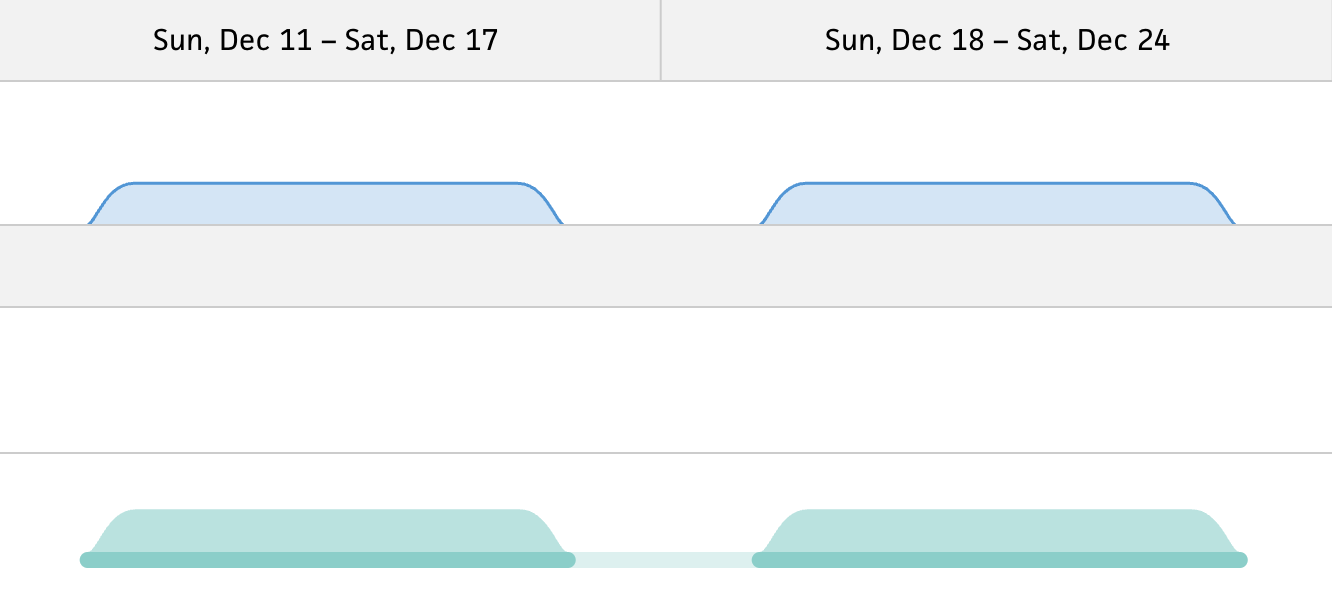
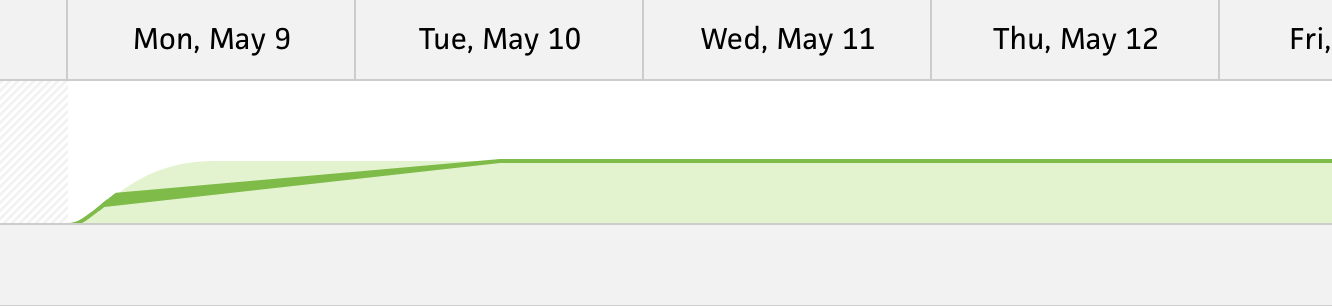
A workload with workdays during the workweek
With tracked time, this was much easier because entries belong to a single date (e.g., I tracked time today, so today’s tracked duration is X hours). For workloads, however, I structured them using start and finish dates, so there’s a range of dates. To make it more complex, I also allow folks to specify which days per week to count. Since these workloads can span weeks or months, there’s a high likelihood that the person won’t be working every single day without a break (or they’ll burn out—and we want to avoid that).
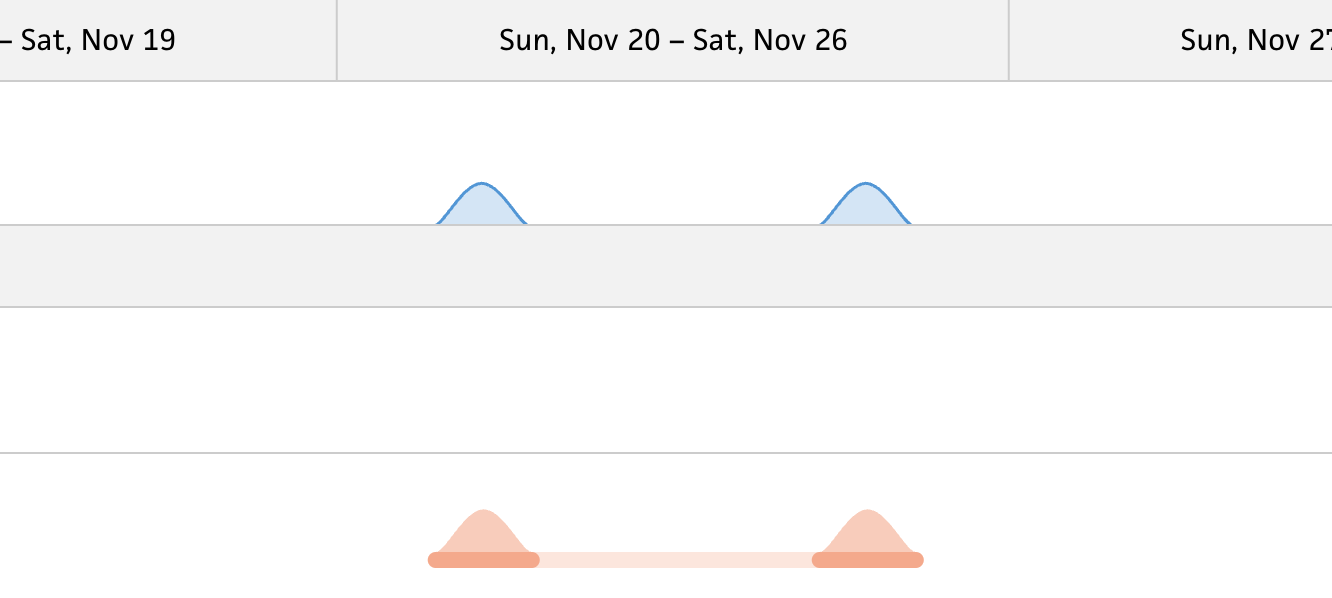
A workload with custom workdays
In the most common case, specifying only weekdays will exclude the weekends. When you consider freelancing, though, you might also have clients for which you work two or three days per week. In order to fit the same tallying and rendering structure as tracked time, this means calculating the estimated duration per day of the selected weekdays between a date range. Once this calculation is done, we end up with the same data structure as tracked time—a date with a duration. From here, I was able to reuse the same code from drawing the path for entries.
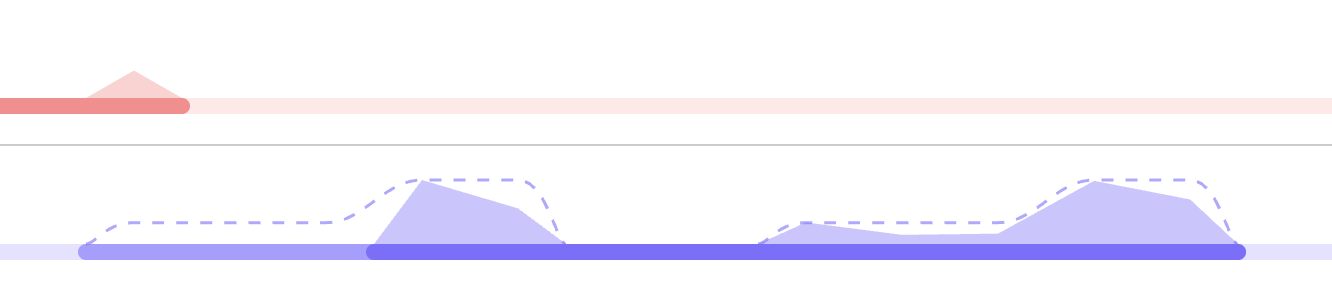
Comparing estimated time with tracked time
While the workloads live in the future, they also exist in the past. It’s incredibly useful in a retro/post-mortem to compare your estimated time on a project versus your actual tracked time. The difference in the case of visuals is that we don’t want workloads to look the same in the past as they do in the future because then they would obscure the visuals for tracked time. Instead, I was able to use a dashed line to represent the estimated time, so folks can easily compare without too much complexity in the timeline. (I’m still on the fence on whether this is the right visual and not in love with it, so I wouldn’t be surprised if I change it sooner than later.)
An SVG rendering glitch in Chrome
For the most part, implementing workloads was a smooth process—especially because I had the existing work from visualizing tracked time. It didn’t go without a hitch, though. When zooming in as far as I could go, I noticed that the stroke on the total workload path at the top would glitch out. Since I scale the paths when zooming, I use vector-effect: non-scaling-stroke to prevent the stroke width from being stretched. This works perfectly fine for all of the zoom levels, except for the deepest one. I thought the glitch my involve an issue with this, but it wasn’t the case.
I dug deeper and found a clue that led me to the real problem. For scaling the timeline, I use a scale property that I multiply every x or width value with. Each zoom level (“Year”, “Quarter”, etc.) represents a different scale number. Instead of using decimals numbers, I decided to enlarge the scale as you zoom in, so the “Week” zoom would multiply ~160. Because this already dealt with significantly large numbers from plotting the timeline, the multiplication resulted in e-based numbers, which are even bigger—like, so big you shouldn’t need those numbers on the web. My hunch was that these numbers were too big for Chrome when scaling the stroke of an SVG, so I refactored by scale to use decimals instead.
As you zoom closer, instead of multiplying by a large number, the timeline never scales larger than one, which means the “Year” zoom is a tiny fraction (1/48 to be precise). This fixed the issue! The entire refactor ended up taking a couple days because I took this opportunity to improve the system, so if I ever need to change the scale again, it’s solely a matter of changing the “timeline pixel ratio” versus refactoring again. Right now, it’s set to 1/600,000, so every pixel represents 1/144 of a day. If I ever decide to add a “Day” zoom level that then shows hours, I can increase the denominator.
While the ability to view estimated workloads in the timeline on its own is incredibly valuable, the next necessary step will be creating workloads inline. This will definitely make the timeline more usable and feel more “whole” (as well as make it easier for me to create example workloads instead of hopping between the timeline and the planner). Once folks can create workloads in the timeline, it will actually be fully usable as a planner on its own. Then, from there, I’ll need to see how to tie in time-tracking. It’s a lot to think about, but at the same time such a fun challenge. Stay tuned!