Viewing Time Reports
Along with tracking time, Cushion has a report view for analyzing your time. In this view, Cushion groups your entries for each day, tallies their totals, and measures them against your weekday.

Start by switching to the report view using the view switcher on the right.

By default, Cushion will display the month report view. Using the graph navigation in the top right, you can visit previous months.
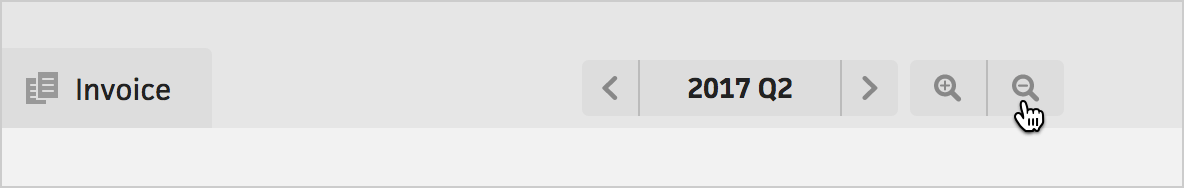
The graph navigation also lets you zoom out to view the quarter and year views.
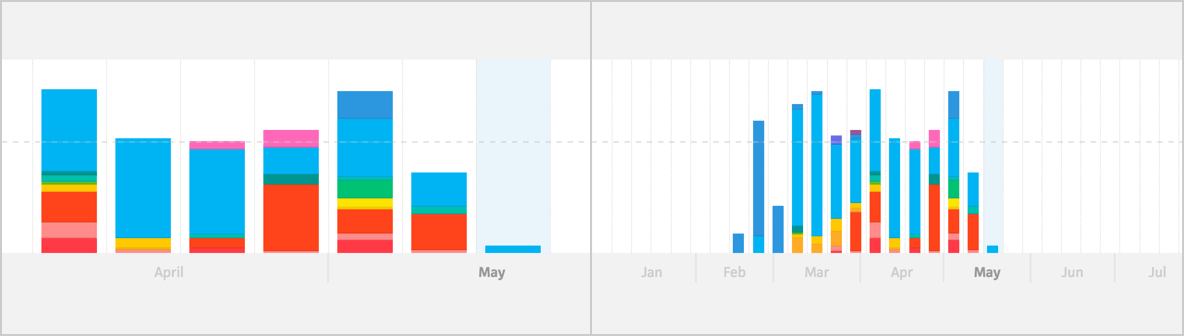
Whereas the month view groups time entries by day, the quarter and year views group time entries by week.
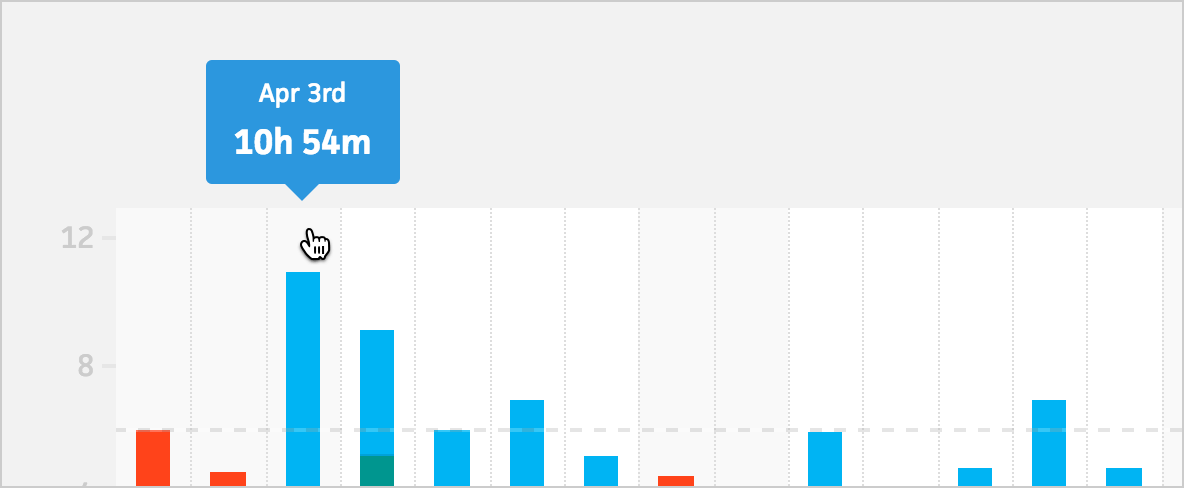
Hovering a column in the report view will display a tooltip with the day or week’s total time.
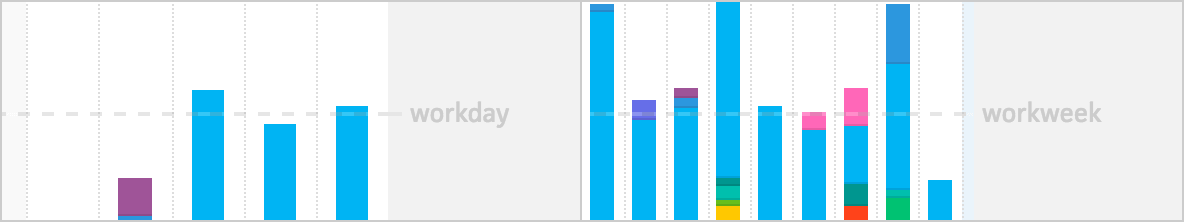
The report view graphs also include a line, so you can measure against your workday or workweek, depending on the zoom level you’re viewing.
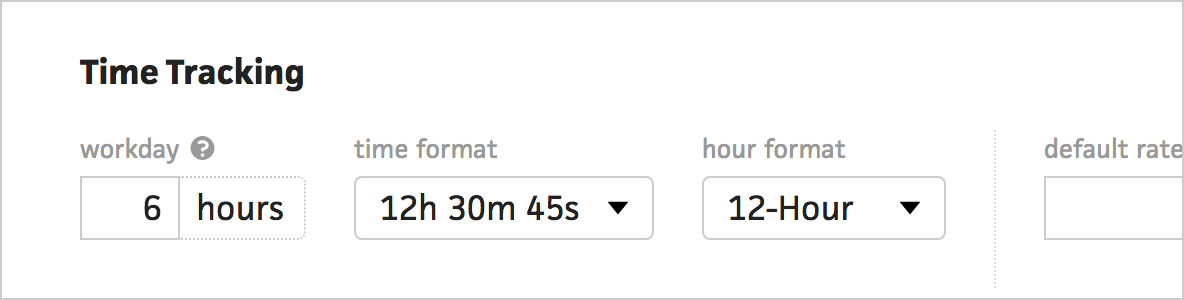
In the preferences, you can adjust your workday. Cushion will automatically calculate your workweek using your workday setting.
Next: Time-Tracking