Monthly income
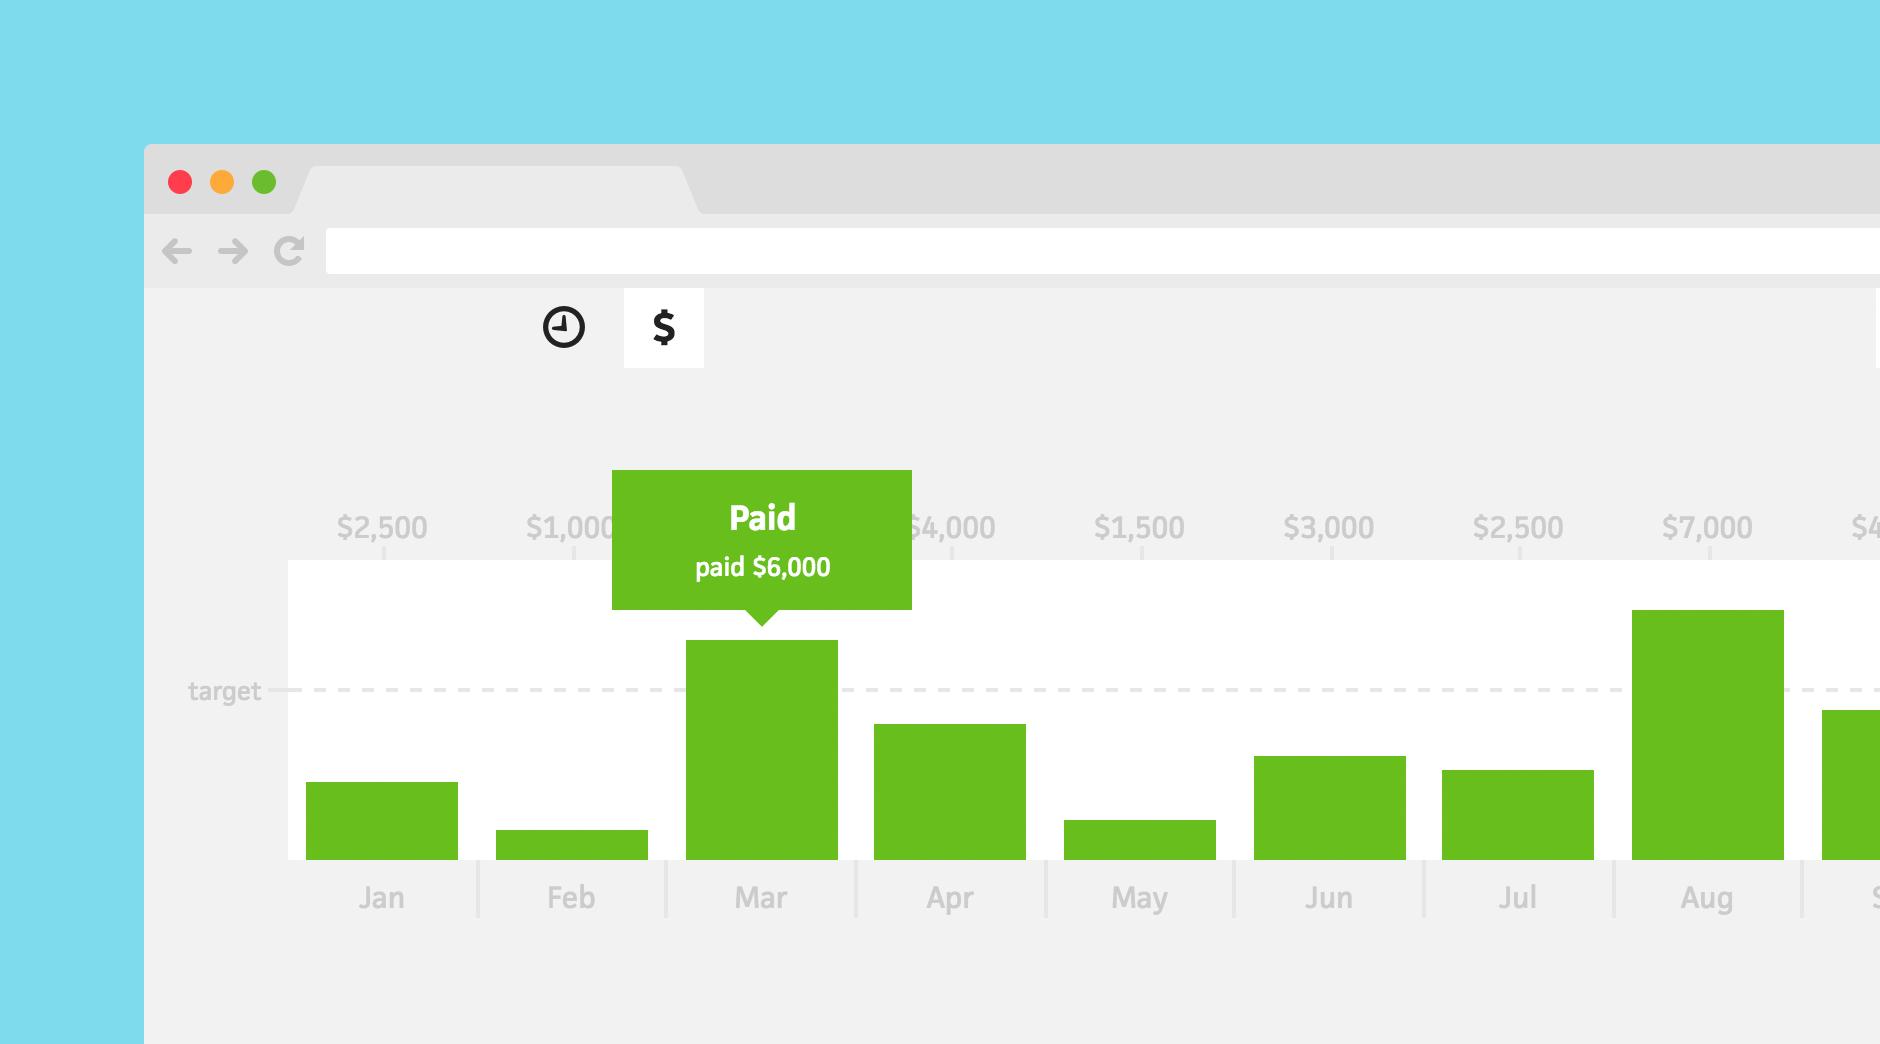

Up until this point, Cushion users have only been able to see their income in relation to their goal for the year. But, what if you want to see how well you’re doing month-to-month? To help with this, I’d like to introduce monthly income!
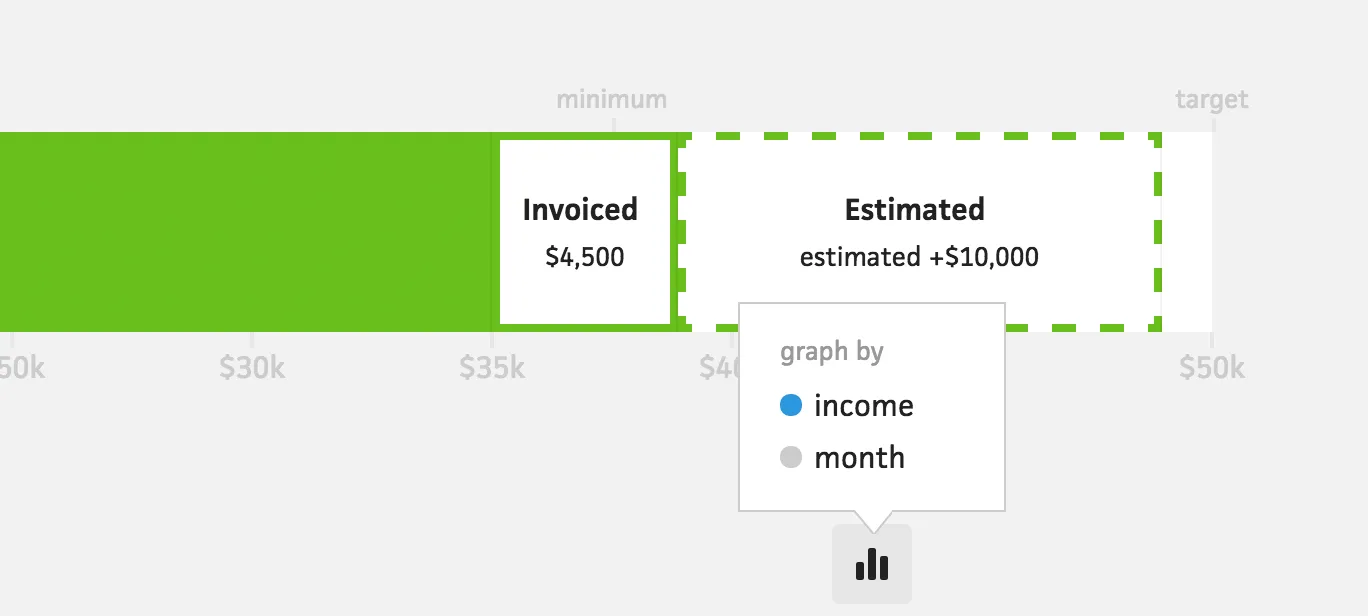
In the budget view, you can now switch between graph types using the new graph menu. Graphing by income will use your financial goals to draw the graph, while graphing by month uses the months of the year.
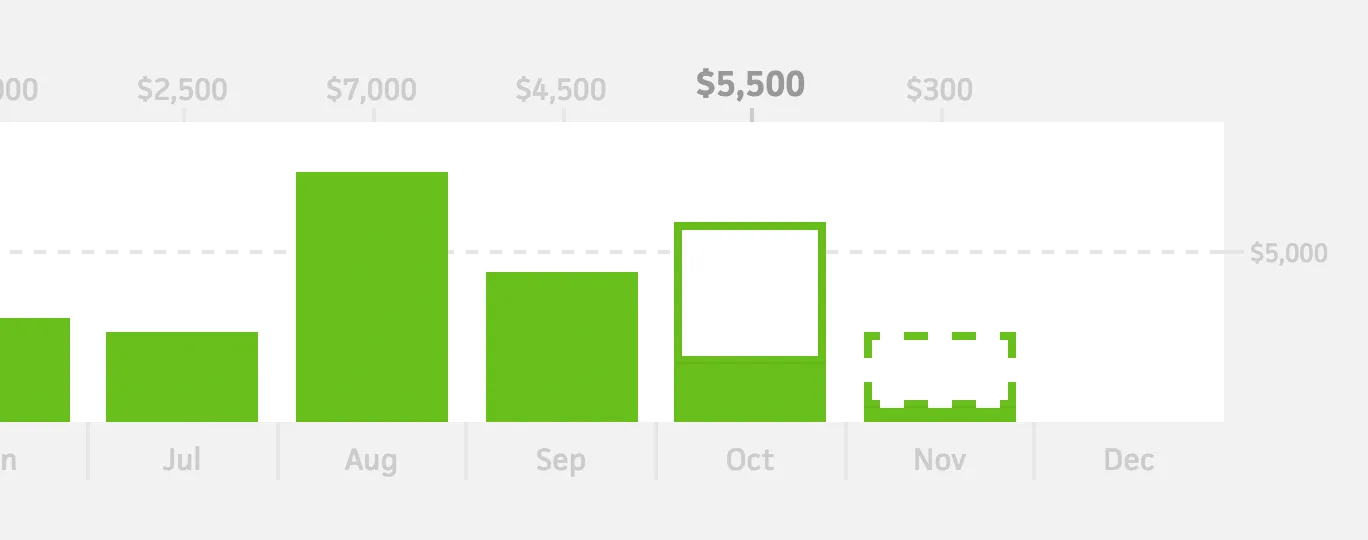
A dashed line represents your monthly financial goal based on your goal for the year. Using this line, you can discover patterns in your year, like which months are slow and which ones are big paydays. You can also see if you’re on pace month-to-month.
Your estimated income will fill empty spots in future months up to your next financial goal. This will give you a good idea of how far a potential project will take you as well as how much you need to make by the end of the year.
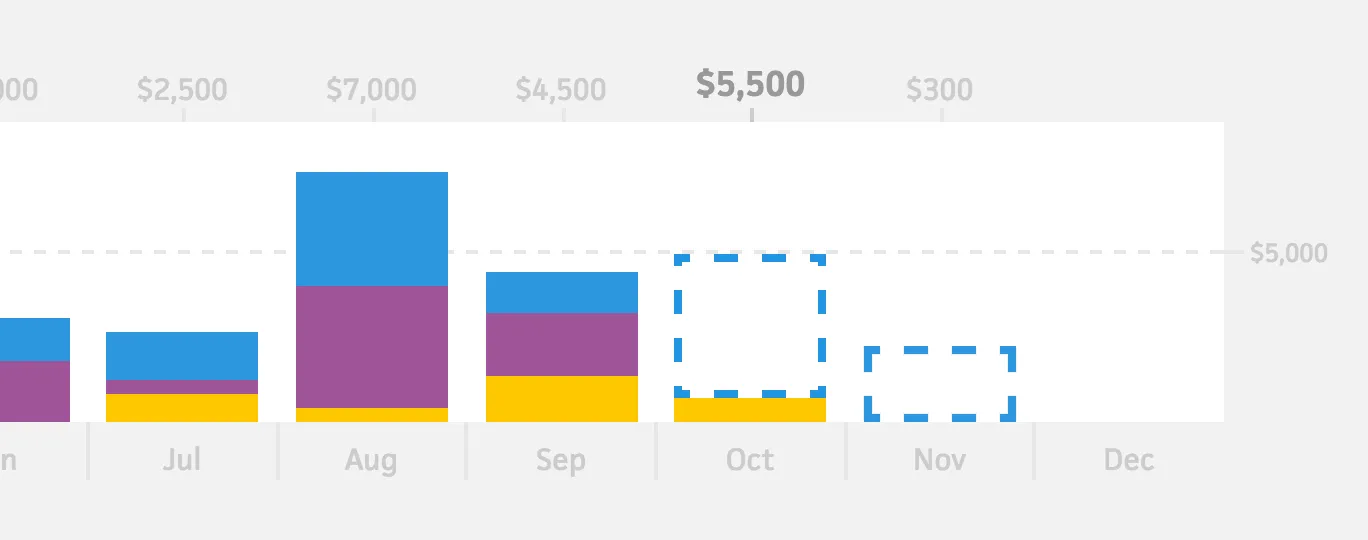
We’re really excited about this new feature as it’s our first step towards visualizing data multiple ways. In doing so, we reveal completely new insights into your freelancing life.